HSC Maths Statistics: Normal Distribution Without the Panic
Statistics in the HSC boils down to one idea: most things cluster around an average, and the further you get from that average, the rarer they become. The normal distribution is just the mathematical shape of that.
Let's break it down.
What the bell curve means
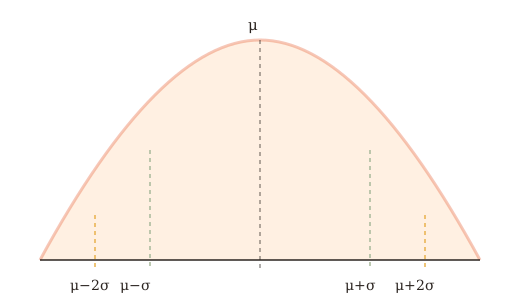
The normal distribution is symmetric and bell-shaped. The centre is the mean (μ). The spread is the standard deviation (σ).
- About 68% of values sit within 1σ of the mean
- About 95% within 2σ
- About 99.7% within 3σ
That's the 68-95-99.7 rule, and it wins you a surprising number of marks with zero calculation.
Standard deviation in plain terms
Standard deviation tells you how spread out the data is. Small σ means values hug the mean. Large σ means they're scattered.
Sometimes you'll compare two datasets: say which has the larger mean, which has the larger spread. Free marks if you remember mean is centre and SD is spread.
Z-scores put data on one scale
A z-score says how many standard deviations a value sits from the mean.
Above the mean gives a positive z. Below gives a negative.
Example: test scores with μ = 70, σ = 10, and a student who scored 85.
So they're 1.5 standard deviations above average. To find the probability of scoring that high, you look up z = 1.5 in the standard normal table or use your calculator's built-in function.
Use the calculator properly
For the HSC you'll use either the z-table or your calculator's normalcdf / invNorm functions. Know which your school uses and practise with it before the exam. The maths is secondary. The button-pressing is where the careless errors creep in.
What NESA actually asks
Usually some mix of:
- A describe or compare question (easy marks)
- A z-score calculation
- A probability given a mean and SD
- Sometimes the reverse: given a percentile, find the raw score
For that last one, flip the formula: x = μ + zσ.
Practise efficiently
Statistics rewards pattern recognition, and the questions are formulaic by design. Work through them topic by topic and the exam starts to feel like déjà vu.
The takeaway
The normal distribution isn't mysterious. Centre is mean, spread is SD, z-score is standardised distance. Get those three straight and the whole topic opens up.